From Data to Decisions: Overcoming the Paradox of Too Much Information
by Uwe Seebacher on Sep 16, 2025
By Prof. Dr. Uwe Seebacher
Structural and Methods Scientist | International Faculty | Thought Leader on Predictive Strategy and Post-Growth Transformation
Introduction
In today’s data economy, leaders are confronted with a paradox. More data is supposed to mean better decisions. At first, this is true: additional data reduces uncertainty, sharpens predictions, and provides context. But beyond a certain point, the flood of information begins to erode decision quality. The result is not empowerment, but paralysis.
This article explores the decision threshold—the tipping point where the benefits of data diminish, and excess information creates confusion, fatigue, and ultimately a decision vacuum. Drawing on decision theory, cognitive psychology, and empirical studies, we demonstrate why this paradox occurs, how it undermines leadership effectiveness, and how Predictive Intelligence offers a pathway forward.
The Paradox of Data Abundance
Data has become the lifeblood of organizations. Dashboards, KPIs, and real-time analytics promise to transform uncertainty into clarity. But managers are increasingly reporting the opposite: information overload, competing signals, and decision fatigue.
This paradox can be explained by the law of diminishing returns. Initially, each new dataset provides valuable insights. Over time, however, the marginal benefit decreases. Eventually, the cost—both cognitive and organizational—outweighs the value. Leaders are left with more dashboards but fewer clear decisions.
A Mathematical View: Utility vs. Cost
We can illustrate this dynamic using a simple mathematical model. Imagine decision-making utility as a function of information quantity:

Where:
-
is the benefit of information.
-
is the cost of processing information.
If benefits grow logarithmically (a common assumption in information theory) and costs grow quadratically (reflecting cognitive and organizational complexity), the result is an inverted U-shaped curve.
At first, benefits dominate. But at a critical point—the decision threshold—costs rise faster than benefits. Beyond this point, more information reduces performance, creating the paradox of “knowing more but deciding less.”

Fig. 1: The utility function U(x) (blue), the cost function C(x) (red, dashed), the information curve I(x) (orange, linearly increasing), and the marked optimum (Source: own illustration).
Insights from Cognitive Psychology
The model reflects a rich body of psychological research:
-
Information Overload (Eppler & Mengis, 2004): Too much information leads to confusion and errors.
-
Decision Fatigue (Baumeister, 2011): Repeated decision-making drains cognitive resources, reducing judgment quality.
-
Choice Overload (Iyengar & Lepper, 2000): More options can reduce satisfaction and hinder decisions.
These findings highlight that human cognition is not limitless. Leaders are not failing because they lack data; they are failing because they lack capacity to process it effectively.
Organizational Symptoms: KPI Inflation and Dashboard Fatigue
Organizations manifest the paradox in specific ways:
-
KPI Inflation
Every department demands its own metrics. Dashboards swell with dozens of KPIs, many of which are vanity metrics. The signal-to-noise ratio plummets. -
Dashboard Fatigue
Managers spend more time interpreting dashboards than making decisions. Meetings turn into debates about metrics rather than actions. -
Decision Vacuum
Faced with conflicting signals, leaders delay choices, defer responsibility, or fall back on intuition. Ironically, data-driven organizations risk becoming less decisive.
The Decision Vacuum: When More Becomes Less
The outcome of KPI inflation and dashboard fatigue is what we call the Decision Vacuum. It is the organizational equivalent of overfitting in machine learning.
-
In statistics, overfitting occurs when a model captures noise instead of signal.
-
In organizations, overfitting occurs when leaders chase spurious correlations and drown in irrelevant KPIs.
Both lead to systems that appear precise but fail when confronted with new realities.
The Role of Predictive Intelligence
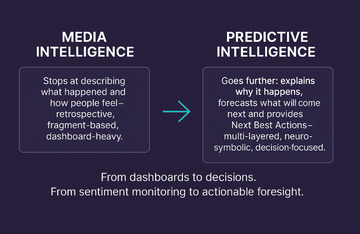
If traditional Business Intelligence (BI) focuses on describing the past, Predictive Intelligence (PI) shifts the focus to shaping the future. PI systems go beyond dashboards by offering Next Best Actions (NBA):
-
Lead Scoring: Predicting which prospects are most likely to convert.
-
Churn Prediction: Identifying which clients are at risk of leaving.
-
Budget Allocation: Optimizing spend based on forecasted ROI.
-
Decision Confidence Index: Indicating how reliable a recommendation is.
Instead of overwhelming managers with hundreds of metrics, PI distills complexity into actionable insights. This reduces cognitive load and helps leaders bypass the decision threshold that paralyzes traditional systems.
Shifting the Sweet Spot
Returning to our model, Predictive Intelligence works by shifting the optimal point—the sweet spot—further to the right.
-
It increases the benefits of information by highlighting relevant patterns.
-
It reduces the costs of processing by filtering out noise.
The result is an expanded zone of high-performance decision-making. Organizations that adopt PI effectively move the ceiling of what humans can handle.

Fig. 2: Curve of costs, utility, and information growth with Predictive Intelligence
(Source: own illustration).
Empirical Evidence
Research supports the effectiveness of this approach:
-
Companies using predictive analytics in marketing achieve 2.9x higher revenue growth (Forrester, 2021).
-
Early adopters of AI-assisted decision systems report a 20–30% reduction in decision cycle times (McKinsey, 2022).
-
Firms with integrated predictive models show greater resilience during market shocks, as they can reallocate resources dynamically (Gartner, 2023).
These findings confirm that PI is not just a theoretical solution but a proven driver of performance.
Implications for Leaders
What does this mean for executives navigating the data economy?
-
Recognize the Threshold
More data is not always better. Leaders must know when dashboards stop helping and start hurting. -
Redesign Metrics
Move beyond vanity metrics. Focus on predictive, process-oriented, and quality-based KPIs. -
Adopt Predictive Intelligence
Shift from dashboards to decision systems that recommend actions. -
Cultivate Trust
Build confidence in predictive systems through transparency and explainability.
Conclusion: From Data to Action
The future of decision-making will not be won by those with the most dashboards, but by those who can transform data into decisive action.
Predictive Intelligence is the enabler of this transformation. By reducing cognitive overload, shifting the decision threshold, and delivering actionable insights, PI ensures that leaders move beyond the illusion of more data toward the reality of better decisions.
The message is clear: It’s time to end the age of dashboards and embrace the age of Predictive Intelligence.
Call to Action
Find the full article on this topic here on Linkedin (only available in German language):
If you are interested in becoming a research partner or jointly deploying a research project with the AQPS Institute, do not hesitate to write an eMail to hello(a)aqps.eu.